LEED Green Façade Design in India – How façade design earns LEED and IGBC points — A complete guide
India is the second-largest country for LEED-certified green buildings globally. The building façade is one of the most powerful levers for earning green building credits — understanding how façade design contributes to LEED certification is essential for any developer or architect.
| Top 2 LEED Buildings in Indiacountry globally by number | 25-40% Energy Savings from optimised façade design | 10-20% Rental Premium for LEED-certified offices |
1. How the Façade Contributes to LEED Credits
A well-designed façade can contribute 15–25 LEED points — the difference between Certified and Gold, or Gold and Platinum.
| LEED Credit Category | Façade’s Role | Potential Points | Design Strategy |
| Energy & Atmosphere (EA) | Reducing heat gain/loss through façade — #1 energy lever | Up to 18 pts | High-performance glazing (low SHGC, high VT); shading devices; thermal insulation |
| Indoor Environmental Quality (IEQ) | Daylight access and views through glazing | Up to 3 pts | Optimise Window-to-Wall Ratio; use high-VT glass |
| Materials & Resources (MR) | Recycled content in aluminium framing; local materials | Up to 5 pts | Specify recycled aluminium; source glass/stone locally |
| Sustainable Sites (SS) | Reducing heat island effect through reflective cladding | Up to 2 pts | Use high-reflectance exterior cladding; green walls |
| Water Efficiency (WE) | Façade-integrated rainwater collection | Up to 1 pt | Design drainage to feed grey water reuse |
| Innovation (IN) | Exemplary performance or innovative façade strategies | Up to 2 pts | Double-skin façade; PV integration; passive solar |
2. Key Façade Design Strategies for LEED in India
2.1 Solar Heat Gain Coefficient (SHGC)
Glass with a low SHGC (0.22–0.32 typical for Indian climates) is the single most impactful glazing parameter for reducing air-conditioning loads. However, simply specifying a low SHGC glass is not enough — the ‘right’ SHGC target depends critically on which facade orientation receives the greatest annual solar radiation, and by how much.
Reducing Solar Exposure Through Facade Orientation
Before a glass specification is fixed, EnvelopeTechnik analyses the annual solar radiation incident on each facade surface using a parametric Radiation Map simulation tool — run directly from Mumbai-Shivaji International Airport weather data (EPW file). The tool deploys 760 sensors across 6 facade surface layers, computing Global Horizontal, Diffuse Horizontal, and Direct Normal irradiance month by month across the full year.
The chart above shows that Mumbai experiences peak Direct Normal Irradiance (DNR) during the pre-monsoon months of March–May, with secondary peaks in October–November. The West and North-West facade orientations receive the highest afternoon radiation loads — often 20–40% more incident energy than the North or South faces. This directly informs which facade requires the most aggressive SHGC specification.
ET’s Radiation Map Analysis Tool
The Radiation Map plugin (Grasshopper/Rhino environment, Revit .cse import supported) runs a full-year simulation — Jan 1 to Dec 31, hourly across 24-hour periods — producing cumulative annual kWh/m² output per sensor node on each facade panel. Results identify “high radiation zones” where a lower SHGC glass must be specified versus “low radiation zones” (typically recessed North-facing areas) where a higher SHGC with better VT can be used to improve occupant comfort without penalty.
Sun Path Studies: Orientation Impact on Incident Radiation
Sun path diagrams for the March equinox and June solstice — the two most critical solar loading periods in Indian climates — clearly show how the solar azimuth and altitude shift across the day. In summer (June), the high solar altitude means the roof and East/West facades absorb the most radiation during 9am–3pm; during March, the lower altitude causes significant penetration into South-facing glazing. A building oriented to minimise East and West glazed area, combined with a facade-specific SHGC (0.22 West / 0.28 North / 0.32 South), can reduce solar heat gain by 25–35% compared to a uniform glass specification.
Sun Path & Shadow Studies: March 21st (equinox, left) vs June 21st (summer solstice, right) — showing solar azimuth, altitude, and shadow patterns at 9:00, 12:00, and 15:00 hrs. Used by ET to determine orientation-specific SHGC requirements.
2.2 Visual Light Transmittance (VT)
High VT glass (above 0.40) allows daylight in while minimising glare. Achieving both high VT and low SHGC requires high-performance coated glass with low-e coatings. The selection of VT is not simply a comfort decision — it directly determines whether a project can earn LEED IEQ Daylight credits (IEQc8.1 and 8.2), which require demonstrating adequate daylight levels and views across a minimum percentage of regularly occupied floor area.
Recommended Interior Illuminance Range
For typical commercial office interiors in India, the target illuminance range at the work plane (0.8 m above floor) is 300–500 lux for general tasks, per NBC 2016 and ECBC 2017 guidelines. LEED daylight simulations assess whether this threshold is achieved through daylight alone for a significant portion of occupied hours. Glass VT directly governs how much of this illuminance is daylight-sourced versus supplemented by artificial lighting:
- VT 0.20–0.30: Poor daylight penetration; heavy reliance on artificial lighting; unlikely to meet sDA thresholds without a large WWR.
- VT 0.35–0.45: Balanced performance; typically achieves 300–400 lux at a depth of 4–5 m from the facade under Indian sky conditions.
- VT 0.50–0.60: High daylight, but requires careful pairing with external shading to control ASE exceedances and glare discomfort.
sDA — Spatial Daylight Autonomy
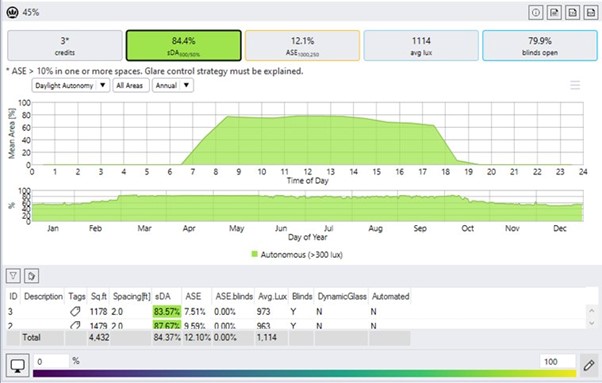
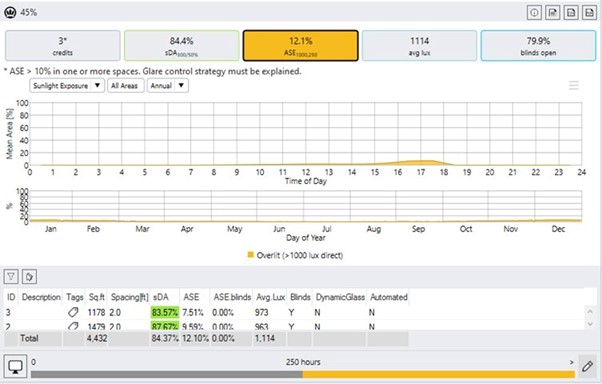
sDA measures the percentage of floor area that receives at least 300 lux from daylight alone for a minimum of 50% of annual occupied hours (typically 8am–6pm, 3,650 hrs/year for a 5-day working week). LEED v4 IEQc Daylight targets:
- sDA≥55% of regularly occupied floor area: 2 points
- sDA≥75% of regularly occupied floor area: 3 points
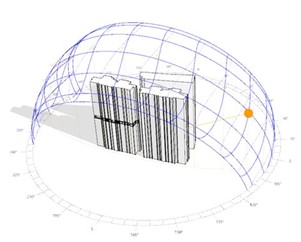
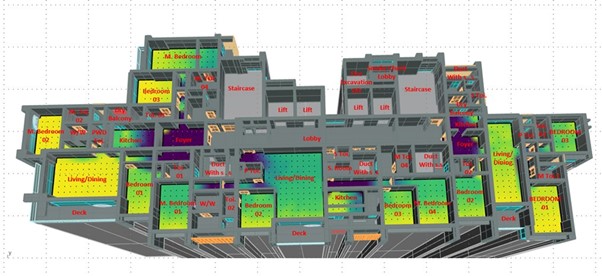
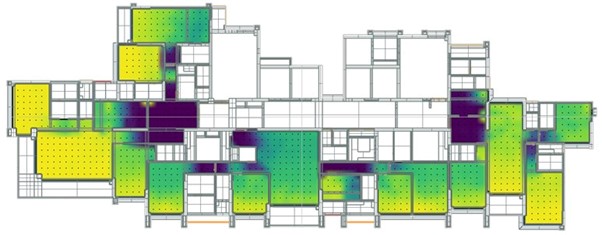
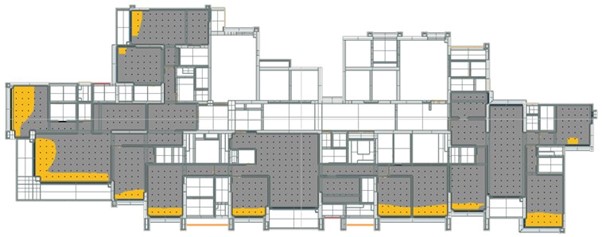
In Indian climates with high ambient luminance, even a moderate VT of 0.40 can achieve sDA≥55% on South and East-facing facades — provided WWR and room depth are appropriately sized. ET’s daylight simulations (run in Grasshopper/Radiance using Perez sky models and local EPW weather data) map the sDA distribution floor-by-floor, identifying zones that fall below threshold and informing targeted increases in VT or WWR.
ASE — Annual Sunlight Exposure
ASE is the counterbalance metric to sDA — it identifies areas that receive too much direct sunlight, creating glare and thermal discomfort. ASE is defined as the percentage of floor area that receives direct sunlight exceeding 1,000 lux for more than 250 hours per year. LEED requires that ASE does not exceed 10% of regularly occupied floor area.
This is where high VT glass, if used without shading, becomes a liability on West and North-West facades in Mumbai, Hyderabad, or Chennai — orientations with high afternoon direct radiation. ET’s daylight analysis overlays sDA and ASE maps simultaneously, identifying the “sweet spot” VT range per orientation that maximises useful daylight while keeping ASE within the LEED compliance boundary. Typical outcomes for Indian commercial projects:
- North facade: VT 0.50–0.60 can be used freely; ASE risk is low.
- East/South facade: VT 0.40–0.50 with horizontal fins; sDA achieved without ASE breach.
- West facade: VT capped at 0.35–0.40; vertical fins mandatory to suppress afternoon ASE exceedance above 10%.
Daylight Analysis Setup — Sun Path & Building Model
Sun path diagram showing solar arc and building orientation — used to determine incident angles per facade for daylight simulation setup.
3D building model with room-by-room daylight zone mapping — colour-coded by space type used in Radiance/DIVA simulation.
sDA Results — Spatial Daylight Autonomy (300 lux / 50% occupied hours)
sDA distribution map: yellow = high daylight autonomy (>300 lux for >50% of hours); dark purple = underlit zones requiring supplementary artificial lighting.
LEED daylight simulation dashboard — sDA₅₀₀/₅₀ = 84.4% of regularly occupied floor area (3 LEED credits); avg. illuminance 1,114 lux across 4,432 sq.ft.
ASE Results — Annual Sunlight Exposure (1,000 lux / 250 hrs threshold)
ASE map: orange zones indicate areas receiving direct sunlight exceeding 1,000 lux for >250 hrs/year — concentrated on West-facing perimeter as expected. ASE = 12.1%, marginally above 10% LEED limit; glare control strategy required.
ASE dashboard — Annual Sunlight Exposure analysis showing overlit hours peak at 16:00–18:00 (West facade afternoon sun). Glare control strategy via operable blinds (79.9% blinds-open baseline) to be documented in LEED submission.
2.3 External Shading Devices
External fins, brise-soleils, and louvres are highly effective in India’s climate — blocking direct solar radiation before it reaches the glass, reducing heat gain without compromising VT.
2.4 Thermally Broken Frames
External fins, brise-soleils, and louvres are highly effective in India’s climate — blocking direct solar radiation before it reaches the glass, reducing heat gain without compromising VT.
2.5 Green / Living Walls
External fins, brise-soleils, and louvres are highly effective in India’s climate — blocking direct solar radiation before it reaches the glass, reducing heat gain without compromising VT.
3. IGBC vs LEED in the Indian Context
| LEED (USGBC/IGBC) | IGBC Rating System |
| Most widely recognised globally; strong for commercial offices | India-specific system developed by CII-IGBC; preferred for residential and industrial |
| Four levels: Certified, Silver, Gold, Platinum | Five-star certification system |
| Strong international developer and occupier recognition | Well understood by Indian developers and government bodies |
| Façade directly influences EA and IEQ credits | Energy performance of façade central to star rating |
🌿 EnvelopeTechnik & Green Façade Design We conduct thermal comfort analysis, sun path and shading studies, and daylight simulations at schematic design stage — ensuring the façade strategy is fully aligned with your sustainability certification goals. contact@envelopetechnik.com | +91 99129 88116 |


